3.5. matplotlib 编程方式#
Show code cell content
import matplotlib.pyplot as plt
import numpy as np
两种编程方式#
基本上有两种使用 Matplotlib 的方法:
依靠
import matplotlib.pyplot as plt自动创建和管理图形和轴,并使用pyplot提供的各类函数进行绘图。简单来说,就是直接用plt.[function_name]()函数作图,比如plt.scatter()画散点图。面向对象编程:先
plt.subplots()显式创建图形和轴,再调用对应的绘图方法。这种方法更为复杂具体,但能满足我们许多精细的要求。前面的例子大多是用第二种方式完成。
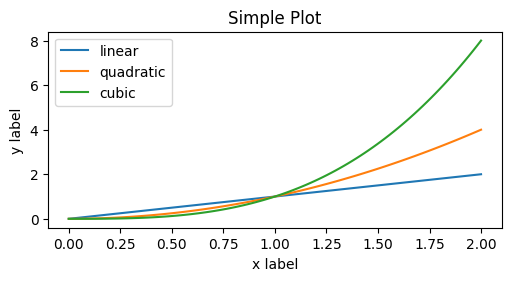
案例:三条曲线#
pyplot-style
x = np.linspace(0, 2, 100)  # 创建一个包含100个点的线性空间,范围从0到2,用作示例数据
plt.figure(figsize=(5, 2.7), layout='constrained') #直接用plt.figure创建图
plt.plot(x, x, label='linear') #在坐标轴上绘制数据,绘制一条线性函数曲线,标签为'linear'
plt.plot(x, x**2, label='quadratic')   # 在同一个坐标轴上绘制二次函数曲线,标签为'quadratic'。
plt.plot(x, x**3, label='cubic') #在同一个坐标轴上绘制三次函数曲线,标签为'cubic'。
plt.xlabel('x label') # 为 x 轴添加标签,将x轴标签设置为'x label'
plt.ylabel('y label')  # 为 y 轴添加标签,将y轴标签设置为'y label'
plt.title("Simple Plot") # 为坐标轴添加标题,将标题设置为'Simple Plot'
plt.legend() # 添加图例,以便显示每条曲线的标签
<matplotlib.legend.Legend at 0x11a61cdd0>

OO-style 面向对象编程
x = np.linspace(0, 2, 100)  # 创建一个包含100个点的线性空间,范围从0到2,用作示例数据
fig, ax = plt.subplots(figsize=(5, 2.7), layout='constrained')#创建一个大小为5x2.7英寸的图形(Figure),并使用constrained_layout参数启用了约束布局。然后,创建了一个坐标轴对象ax,可以用来绘制数据。
ax.plot(x, x, label='linear')  #在坐标轴上绘制数据,绘制一条线性函数曲线,标签为'linear'
ax.plot(x, x**2, label='quadratic')  # 在同一个坐标轴上绘制二次函数曲线,标签为'quadratic'。
ax.plot(x, x**3, label='cubic')  #在同一个坐标轴上绘制三次函数曲线,标签为'cubic'。
ax.set_xlabel('x label')  # 为 x 轴添加标签,将 x 轴标签设置为'x label'
ax.set_ylabel('y label')  # 为 y 轴添加标签,将 y 轴标签设置为'y label'
ax.set_title("Simple Plot")  # 为坐标轴添加标题,将标题设置为'Simple Plot'
ax.legend()  # 添加图例,以便显示每条曲线的标签
<matplotlib.legend.Legend at 0x11a674dd0>

